MCP insights & logs
Agents do not file support tickets. When a tool call fails, loops, or slows to a crawl, the only witness is the wire — so Elva records it. Every hosted MCP server ships with observability for the agent era: per-agent activity, per-tool health, latency percentiles, token metering, and a call-by-call log, with zero instrumentation on your side.
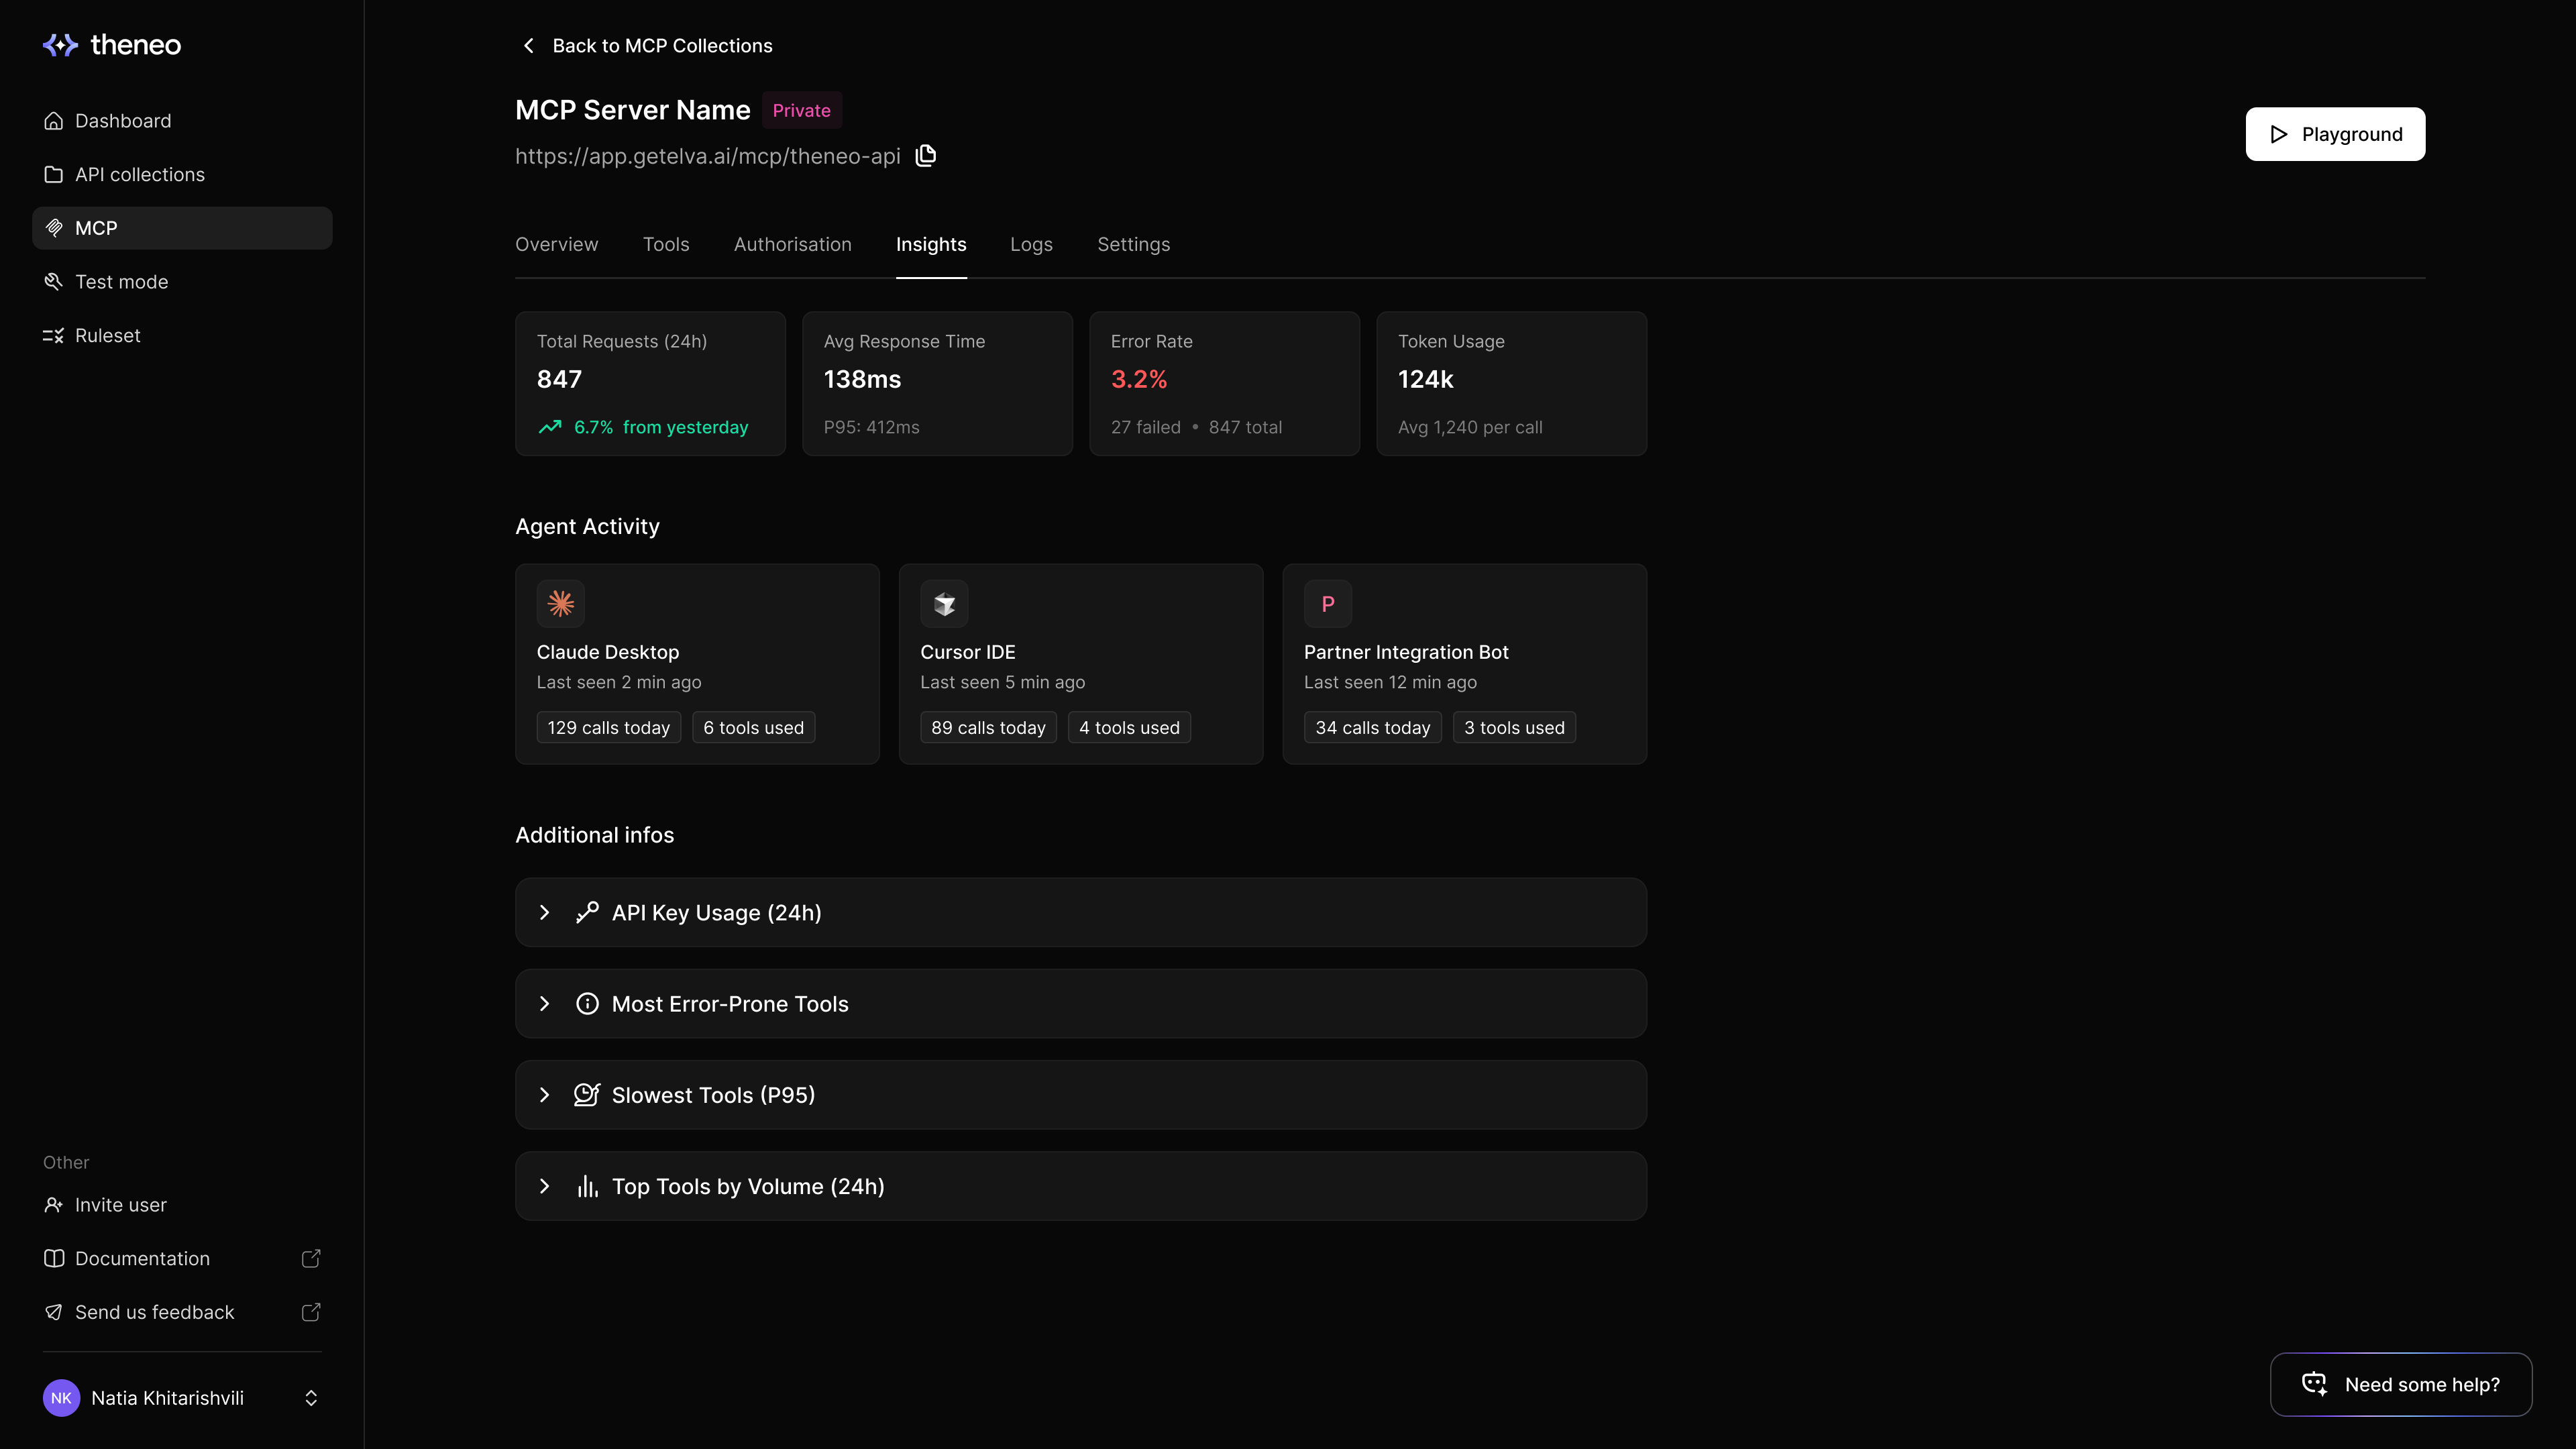
Your MCP server, six tabs
Open any MCP server in Elva and everything about it lives in one workspace. Insights and Logs are the observability half.
Tab | What it holds |
Overview | The server's identity: name, visibility badge, and the live MCP URL agents connect to |
Tools | Every operation you exposed as a tool, exactly as agents see it |
Authorization | How the gateway authenticates to your upstream API |
Insights | Rolled-up metrics: requests, latency, errors, tokens, agents, and per-tool breakdowns |
Logs | The raw feed — one entry per tool invocation |
Settings | Branding, visibility, custom slug, and the public install page configuration |
Four numbers that tell you if agents are winning
Choose a date preset or a custom range to review requests, latency, errors, and token estimates for that period. Keep the same range when comparing panels.
Metric | Meaning |
Total requests | Call volume in the selected period. |
Response time | Average latency and available percentiles. |
Error rate | Failed calls as a share of recorded calls. |
Token usage | Recorded token estimates; these are not a provider billing statement. |
Agents retry. A human hits a broken endpoint once and gives up; an agent may hammer it in a loop. That is why error rate and token usage sit on the same row — a failing tool is usually also an expensive one.
Agent activity: who is actually using your API
This is the adoption dashboard most API teams have never had. Elva auto-detects each calling client from its requests — claude, cursor, windsurf, copilot, or the raw identifier for anything else, such as openai-mcp/1.0.0 (Codex) — and renders a card per agent:
Agent cards show available identity, last-seen time, call activity, and tools used. Interpret counts within the selected date range and the labels shown on the panel.
You do not tag anything and agents do not register. They connect, they call, and they appear.
This is the question every platform team is about to be asked: "which AI assistants use our API, and for what?" With Elva the answer is a screen, not a research project.
Drill-down panels: from symptom to culprit
Use the drill-down panels to inspect credential usage, error-prone tools, latency percentiles, and tool volume in the selected range.
Panel | What to inspect |
API key usage | Credential-related usage where attribution is available. |
Most error-prone tools | Tools with failures and their recorded error details. |
Slowest tools | Latency percentiles by tool. |
Top tools by volume | Operations consumers call most often. |
The Logs tab: every call, on the record
The Logs tab shows recorded tool calls with available agent and caller attribution, tool name, status, timestamps, and timing. Use filters to narrow a problem to a specific caller, tool, outcome, or period.
That single feed does double duty:
- Debugging. A tool started failing at 14:02? The log shows which agent, which arguments pattern, and which upstream status — before your first guess.
- Audit. When security asks “what exactly did the agent touch,” you scroll, you do not reconstruct.
MCP webhooks send tool-call events to your receiver for automation. They do not deliver workspace audit events. See MCP webhooks for receiver setup, signatures, and retries.
Logs record what the gateway saw. When an agent can tell you why a call was wrong, it files a structured report instead. See Agentic feedback.
From signal to fix
The views are designed to chain, so a bad metric turns into a shipped fix in minutes:
Find the change | Choose the period in which the error or latency increase occurred. |
Identify the tool | Compare error-prone and slowest-tool panels. |
Inspect calls | Filter Logs by tool, outcome, and caller; read the recorded failure. |
Fix and publish | Correct authentication, upstream behavior, or the API definition. Publish changed MCP definitions when needed. |
Verify | Make a representative call and compare a fresh period against the original range. |
The demo MCP server can contain sample activity for exploration. Your own deployments should be evaluated using their recorded traffic; an empty range can simply mean no calls were recorded.
FAQ
Agent identity depends on the information clients provide and Elva can recognize; it is not always a verified human identity. Insights aggregate recorded calls. When a metric looks unexpected, compare its time range and filters with the underlying logs.
Where to go next

The enterprise MCP gateway
The control point that writes these logs: auth relay, encrypted envelopes, and tool-level exposure control.

AI readiness
Fix the schema and description gaps behind malformed-argument failures before agents hit them.
Filter and export logs
The logs API supports from and to dates, agentId, clientId, userId, toolName, status (success or error), sort (time or duration), and order (asc or desc). Use format=csv for export. A date-only to value includes that full UTC day; an explicit timestamp is treated as the exact instant.
Set WORKSPACE_ID and MCP_SLUG to your deployment's values, and supply ELVA_TOKEN through your environment or secret store. Protect exported logs as operational data. If the export includes a truncation notice, narrow the date range and export the remaining intervals.
 import os
import shutil
import urllib.parse
import urllib.request

workspace = urllib.parse.quote(os.environ["WORKSPACE_ID"], safe="")
mcp_slug = urllib.parse.quote(os.environ["MCP_SLUG"], safe="")
query = urllib.parse.urlencode({
    "format": "csv",
    "from": "2026-09-01",
    "to": "2026-09-07",
    "status": "error",
})
url = f"https://api.getelva.ai/api/companies/{workspace}/mcps/{mcp_slug}/logs?{query}"
request = urllib.request.Request(
    url,
    headers={"Authorization": "Bearer " + os.environ["ELVA_TOKEN"]},
)
with urllib.request.urlopen(request, timeout=30) as response:
    with open("mcp-errors.csv", "wb") as output:
        shutil.copyfileobj(response, output)


On this page
- MCP insights & logs